

It is crucial to have a good command over the Quantitative Aptitude section to score high in competitive exams and make it to the final merit list. With frequent quizzes based on different topics from the Quantitative Aptitude section, Exammr has come to your rescue in improving your mathematical skills with the passage of each day.
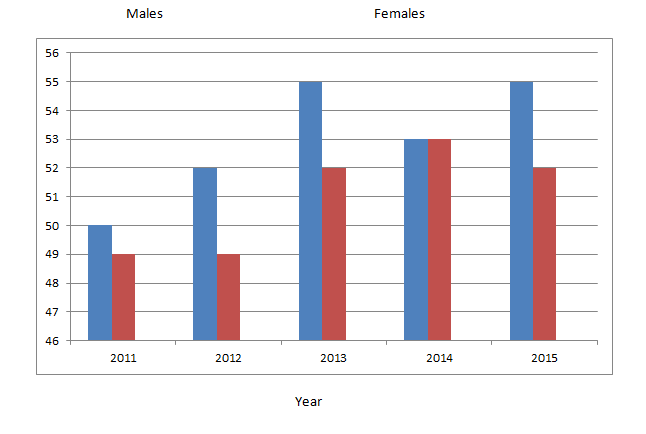
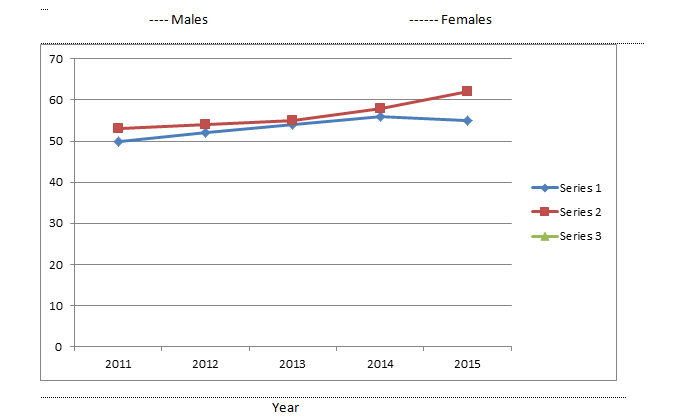
Direction (1-5): Study the bar graph and line graph carefully to answer the questions given below.
The bar graph shows the number of males and females (in thousand) in town X during the given years.
The line graph shows the number of males and females (in thousand) in town Y during the given years.
1. What is the ratio of the average number of males in town X to the average of males in town Y for the given period?
1. 269:282
2. 265:281
3. 265:283
4. 265:282
5. Other than the given options
2. In which of the following years, is the percentage increase or decrease in the number of females for town Y the minimum?
1. 2015
2. 2014
3. 2012
4. 2013
5. Both 1) and 2)
3. The population o town X in 2011 and 2012 together is approximately what per cent of the population of town Y in 2014 and 2015 together?
1. Other than the given options
2. 81.6%
3. 89.6%
4. 84.5%
5. 86.6%
4. Find the number of years in which the number if females in town X and Y are less their respective average numbers.
1. One, Two
2. Two, Two
3. None
4. Three, Two
5. Other than the given options
5. In which of the following pairs of years in the difference in the number of males and females the maximum for town Y and minimum for town Y and minimum for town X respectively?
1. 2011 and 2014
2. 2015 and 2011
3. 2015 and 2014
4. 2013 and 2015
5. Other than the given options
Study the following Line chart and the following questions carefully:
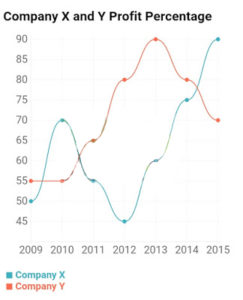
1. If the profit earned in 2011 by Company Y was Rs. 8,12,500, what was the total income of the Company in that year?
1. Rs. 12, 50, 000
2. Rs. 20, 62, 500
3. Rs. 16, 50, 000
4. Rs. 18, 25, 000
5. Rs. 17,78,000
2. If the amount invested by the two Companies in 2010 was equal, what the ratio between the total income in 2010 of the Companies X and Y respectively?
1. 31 : 33
2. 33 : 31
3. 34 : 31
4. 14 : 11
5. None of these
3. If the total amount invested by the two Companies in 2014 was Rs. 27 lakhs, while the amount invested by Company Y was 50% of the amount invested by company X, what was the total profit earned by the two Companies together?
1. Rs. 21. 15 lakhs
2. Rs. 20. 70 lakhs
3. Rs. 18. 70 lakhs
4. Rs. 20. 15 lakhs
5. None of these
4. If the investments of Company X in 2012 and 2013 were equal. What is the difference between profit earned in two years if the income in 2013 was Rs. 24 lakhs?
1. Rs. 2. 25 lakhs
2. Rs. 3. 6 lakhs
3. Rs. 1. 8 lakhs
4. Rs. 2. 6 lakhs
5. None of these
5. If each of the Companies X and Y invested Rs. 25 lakhs in 2015, what was the average profit earned by the two companies?
1. Rs. 18 lakhs
2. Rs. 22. 5 lakhs
3. Rs. 17. 5 lakhs
4. Rs. 20 lakhs
5. None of these
Answers:
4. 265:282
1. 2015
5. 86.6%
2. Two, Two
3. 2015 and 2014
2. Rs. 20, 62, 500
3. 34 : 31
2. Rs. 20. 70 lakhs
1. Rs. 2. 25 lakhs
4. Rs. 20 lakhs
Share this article
Popular Exams
- Vacancies: 45284
- Exam Year: 2023
- Conducted By: SSC
- Category : Central Government Exam
- Vacancies: 1673
- Exam Year: 2022
- Conducted By: SBI
- Category : Banking & Insurance
- Vacancies: 312
- Exam Year: 2022
- Conducted By: BSF
- Category : Defence & Police
- Vacancies: 577
- Exam Year: 2023
- Conducted By: UPSC
- Category : Central Government Exam
- Vacancies: 174
- Exam Year: 2024
- Conducted By: HPSC
- Category : Haryana State Exam
Related Articles

We all are familiar with the fact that current affairs play a vital role in cracking any competitive exams. And, since you are on this page, you must
- Ajay Singh
- Feb 26, 2022
- 63 Views
It is crucial to have a good command over the General Knowledge section to score high in competitive exams, especially SSC and Civil Services, and mak
- Ajay Singh
- Feb 25, 2022
- 42 Views
We all are familiar with the fact that current affairs play a vital role in cracking any competitive exams. And, since you are on this page, you must
- Ajay Singh
- Feb 24, 2022
- 13 Views
We all are familiar with the fact that current affairs play a vital role in cracking any competitive exams. And, since you are on this page, you must
- Ajay Singh
- Feb 23, 2022
- 10 Views
We all are familiar with the fact that current affairs play a vital role in cracking any competitive exams. And, since you are on this page, you must
- Ajay Singh
- Feb 23, 2022
- 8 Views
Trending Articles
The Indian Merchant Navy has published the recruitment notification for the Deck Rating, Engine Rating, Seaman, Electrician, Welder/Helper, Mess Boy,
- Govind Sharma
- Apr 10, 2024
- 17 Views
The Steel Authority of India Limited (SAIL) has published the recruitment notification for the post of Executive and Non-Executive Cadre in Employment
- Govind Sharma
- Apr 4, 2024
- 14 Views
The Uttarakhand Cooperative Institutional Service Board has published the recruitment notification for the Group-3 (Clerk-cum-Cashier), Group-2 (Junio
- Govind Sharma
- Apr 12, 2024
- 10 Views
National Institute of Technology Durgapur (NIT Durgapur) has published the recruitment notification for the various faculty positions in Employment Ne
- Govind Sharma
- Apr 4, 2024
- 6 Views
NTPC Green Energy Limited (NGEL) has published the recruitment notification for the various posts in Employment News (March 30-Apr 04) 2024. A total o
- Govind Sharma
- Apr 6, 2024
- 5 Views
Latest Articles
Bihar Gram Swaraj Yojana Society has published the recruitment notification for the post of Accountant IT Assistant on its official website. A total o
- Govind Sharma
- Apr 23, 2024
- 3 Views
Himachal Pradesh Public Service Commission (HPPSC) has published the recruitment notification for the various Administrative posts on its official web
- Govind Sharma
- Apr 23, 2024
- 1 Views
The Uttar Pradesh Public Service Commission (UPPSC) has published the recruitment notification for the Agricultural Services on its official website.
- Govind Sharma
- Apr 23, 2024
- 0 Views
AI Airport Services Limited (AIASL) has published the recruitment notification for the post of Utility Agent Cum Ramp Driver and Handyman/ Handywoman
- Govind Sharma
- Apr 23, 2024
- 0 Views
Andhra Pradesh Public Service Commission (APPSC) has published the recruitment notification for the post of Forest Range Officer on its official websi
- Govind Sharma
- Apr 23, 2024
- 0 Views
The Kerala Public Service Commission (KPSC) has published the recruitment notification for the Farm Assistant Grade II (Agri) under the Kerala Agricul
- Govind Sharma
- Apr 23, 2024
- 0 Views
Railway Protection Force (RPF) has published the recruitment notification for the post of Constable and Sub Inspector in Railway Recruitment Boards on
- Govind Sharma
- Apr 20, 2024
- 1 Views
Kerala PSC Recruitment 2024 has published the recruitment notification for the Office Assistant posts for Kerala State Co-operative Bank Limited. A to
- Govind Sharma
- Apr 20, 2024
- 2 Views
Airports Authority of India (AAI) has published the recruitment notification for the post of Junior Executive on its official website. A total of 490
- Govind Sharma
- Apr 19, 2024
- 1 Views
Rail India Technical and Economic Service Limited (RITES) has published the recruitment notification for the post of Assistant Manager on its official
- Govind Sharma
- Apr 19, 2024
- 0 Views